Coders StopPython’s Streamlit vs. Dash: Building Stunning Data DashboardsData dashboards are a critical tool for modern decision-making. Whether you’re visualizing business performance, tracking user metrics, or…Jan 17112Jan 17112
NocoBaseTop 11 Open-Source Admin Dashboard Projects on GitHub🌟 Discover the top 11 open-source admin dashboard projects on GitHub! From simple templates to feature-rich platforms.Dec 27, 20242932Dec 27, 20242932
InLevel Up CodingbyArman Hossen🚀 Taipy: The 10X Python Framework That’s Making Streamlit Obsolete in 2024How This Game-Changing Tool is Revolutionizing AI Web Apps: Build Enterprise-Grade Applications in Pure Python with Zero JavaScript | A…Dec 19, 2024157Dec 19, 2024157
J.Building a Real-Time Analytics Dashboard with Python and Apache KafkaOct 24, 2024912Oct 24, 2024912
InTDS Archiveby💡Mike ShakhomirovMastering Data Streaming in PythonBest Practices for Real-Time AnalyticsAug 16, 20242261Aug 16, 20242261
In𝐀𝐈 𝐦𝐨𝐧𝐤𝐬.𝐢𝐨byCarlo C.FastHTML: Easy development for web applications in PythonFastHTML is an innovative web framework designed to make it easier to build applications in Python. This tool stands out for its simplicity…Sep 16, 202424Sep 16, 202424
InBootcampbyaprilLow Code Project to Build Admin Panels, Internal Tools, and DashboardsAppsmith is an open-source platform to build, deploy, and maintain internal apps. You can build anything from simple CRUD apps, admin…Sep 21, 20222051Sep 21, 20222051
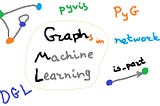
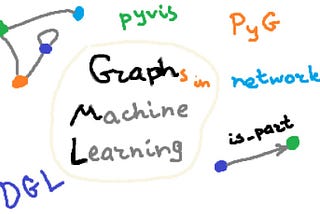
InTDS ArchivebyDmytro Nikolaiev (Dimid)Graphs with Python: Overview and Best LibrariesGraph analysis, interactive visualizations, and graph machine learningDec 2, 20222982Dec 2, 20222982
InUX CollectivebyMatt Jedraszczyk11 steps to keep Figma cleanWe all probably already know how it is to receive a project from someone else. Not everyone works the same way, it’s what makes our field…Aug 20, 20222.3K19Aug 20, 20222.3K19
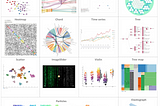
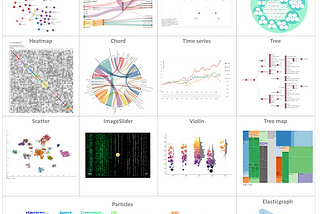
InTDS ArchivebyErdogan TaskesenD3Blocks: The Python Library to Create Interactive and Standalone D3js Charts.Create interactive, and stand-alone charts that are built on the graphics of d3 javascript (d3js) but configurable with Python.Sep 22, 20221.2K13Sep 22, 20221.2K13
Jairo Jr. Rangel R.Advanced Interactive Dashboards in PythonConnect differents APIs to create an advanced interactive dashboard for analysis.May 25, 20221K13May 25, 20221K13
InTDS ArchivebySophia Yang, Ph.D.Big Data Visualization Using Datashader in PythonHow does Datashader work and why is it crazy fast?Oct 6, 20213862Oct 6, 20213862